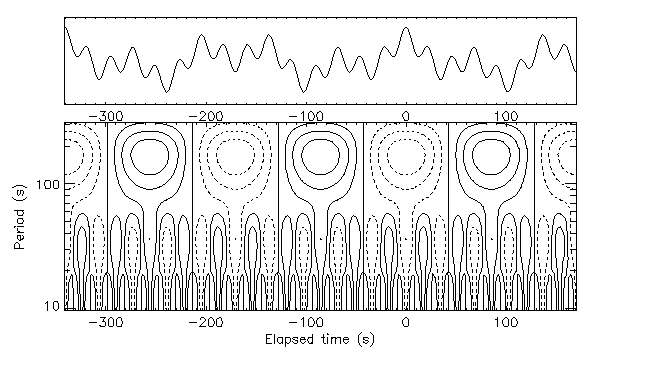


Let us now turn to gradually more complicated signals, for which we soon lose the support of analytical expressions of the transforms. First, examine the sum of 3 cosine waves at different frequencies and phases. The Mexican hat wavelet analysis is carried out as above, yielding the wavelet map (Fig. 11). The separation of the different frequencies is clearly visible, as is the phase relationship between the three cosines.


