


Analytically, by integrating the energy density over an integer number of periods, we get

The result is not as sharp as in the Fourier case, where the
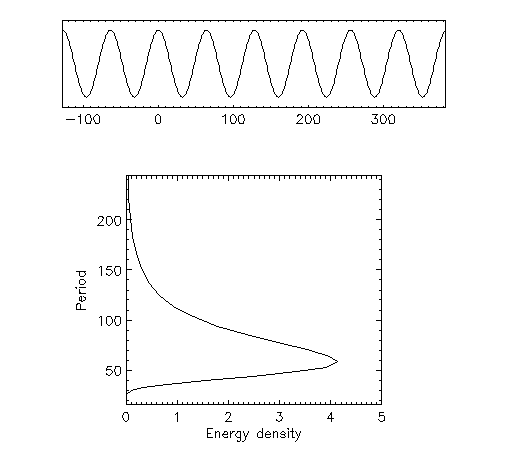
spike at frequency  is due to the exceptionally
good match between the analyzing function (a sine wave) and the
signal - an occurence that is common in linear system response,
but not in non-linear phenomena. The compromise we reached
in allowing for single bump localization (something Fourier cannot
do) reduces the spectral accuracy.
is due to the exceptionally
good match between the analyzing function (a sine wave) and the
signal - an occurence that is common in linear system response,
but not in non-linear phenomena. The compromise we reached
in allowing for single bump localization (something Fourier cannot
do) reduces the spectral accuracy.
This can be expressed mathematically as follows. Denote by  the Fourier transform of the signal,
  the Fourier transform
of the Mexican hat wavelet. Then, substitutions and simple
manipulations of the integrals give the alternative expression
of the wavelet transform:
the Fourier transform
of the Mexican hat wavelet. Then, substitutions and simple
manipulations of the integrals give the alternative expression
of the wavelet transform:

 is reflected in the width of its spectrum
; as a narrow wavelet will have a broadband spectrum we see
that the compromise between local and spectral localization cannot be
avoided.
is reflected in the width of its spectrum
; as a narrow wavelet will have a broadband spectrum we see
that the compromise between local and spectral localization cannot be
avoided.