Take a particularly simple signal: a cosine wave. It is immaterial for this introduction that a Fourier analysis would, objectively, be better in this case (If you only have periodic signals in your lab, you don't need wavelets).
Now, we are going to stretch and shrink the wavelet along the
time axis (we assume the data is in the time domain), and at each
time compare the shape of the signal to that of the wavelet.
The duration of the wavelet can be measured by the width of
its trough, or similar measures: for mathematical reasons, we
have adopted the distance between the minimum
of  and its
first zero-crossing as the unit duration. To scan a full cycle
of an oscillation will require approximately 4 durations of the
Mexican hat (Fig. 3 shows two wavelets offset by 2 durations).
and its
first zero-crossing as the unit duration. To scan a full cycle
of an oscillation will require approximately 4 durations of the
Mexican hat (Fig. 3 shows two wavelets offset by 2 durations).
Let us do this analytically. Let  be the
signal, and the wavelet at the approximately matching duration
is
be the
signal, and the wavelet at the approximately matching duration
is  .
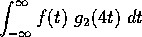
We can measure the `match' between the wavelet and the
signal by the integral
.
We can measure the `match' between the wavelet and the
signal by the integral
with a preponderance of negative contributions initially.
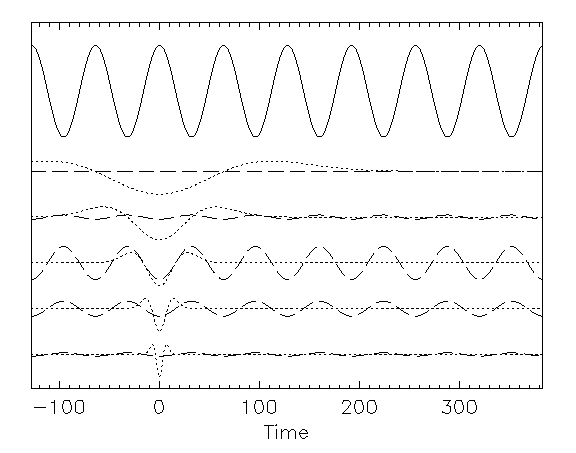
To examine the function at a different time T, we have
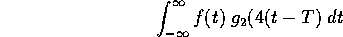
giving successively increasing values, then decreasing, then increasing again, as T increases.
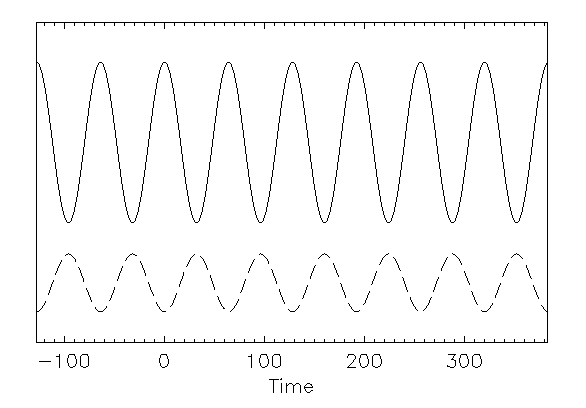
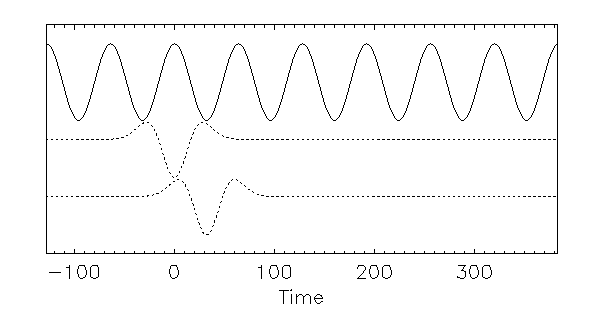
Now, let us repeat this process with a wavelet of similar shape,
but of much shorter or longer duration (Fig 5).
This wavelet does not replicate the features of the signal very well.
In fact, as the duration becomes shorter and shorter, the signal
will be more nearly constant over the duration of the wavelet,
and the integral will decrease in absolute value.
A similar trend occurs if the wavelet has a much longer duration,
say  ): several oscillations of the signal will
be included in the trough of the wavelet, with little net
result. Thus we see that one of the results of the
admissibility condition (section 3) is that the wavelet
automatically subtracts the local mean value of the signal.
): several oscillations of the signal will
be included in the trough of the wavelet, with little net
result. Thus we see that one of the results of the
admissibility condition (section 3) is that the wavelet
automatically subtracts the local mean value of the signal.