Feature enhancement: local maxima


Next: Data reduction: histograms
Up: No Title
Previous: Feature enhancement: normalizing
In some applications, the presence of a `bump' in a signal may
be more significant than its size. Then, it is imperative to display
a local maximum, say, of the wavelet map by factoring out its magnitude,
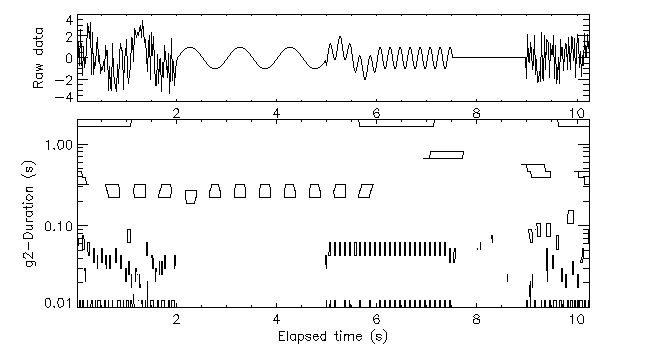
giving equal emphasis to molehills and mountains. The following
algorithm has been implemented for generate Fig. 25:
- identify a realistic size of an event on the wavelet map; for
example, a rectangular box one-duration wide and allowing for
limited ratio of durations in height, has been used.
- identify all local maxima by placing a box around them and
verifying that no larger values occur within the box.
- within each box, normalize the values of the map by the local
maximum.
- threshold what is left to show the vicinity of each maximum.
The result of these operations is shown below for the intermittent
signal used in previous sections; a more complicated example
was used in Fig.1.

Figure 25: Local maxima of g2-energy map.


Jacques Lewalle
Mon Nov 13 10:51:25 EST 1995


