


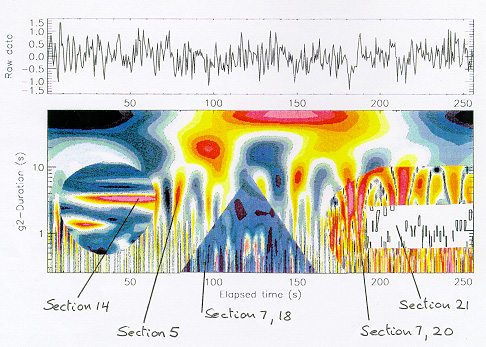
Figure: Data characterization using wavelets. The time axis is common
to the raw data and the wavelet map (background), for which the vertical
axis is analogous to an inverse frequency (Section 10). The Mexican hat wavelet
(Section 3) used for the background wavelet map (Section 5)
measures the magnitudes of local maxima (blue-grey shades) and minima
(yellow/red shades) as a function of time and duration. Inserts show
the local periodicity of fluctuations (Section 14), normalized energy
density (Sections 7 and 20), pulsing of energy (Section 18) and local
maxima of energy (Section 21).
Fig. 1 shows how a short excerpt from a single data set can yield different results, depending on which features are enhanced. The numbers refer to Sections of this manual where the corresponding algorithm is introduced. Since the figures are the graphical representation of large arrays in the computer, these arrays can be manipulated quantitatively to give unambiguous numbers.